Presidential Debate Tone Analysis
An analysis using IBM's Watson Analytics Tone Analyzer API
by Catalina Arango
Posted on October 20, 2016 at 9:05 AM
A portion of the above image was borrowed from Business Insider | Dragan Radovanovic
Presidential debates are obviously a popular topic on election year, but this year, interest in the presidential debates has really skyrocketed. While many are flabbergasted by the words of a particular candidate, we rarely discuss the tone behind both candidates' comments. However, as human beings, tone is just as important as words.
I thought it would be interesting to apply an algorithm to the speeches of the Final Presidential Debate that could tell us a little about each candidate's tone. Luckily for me, IBM's Watson Analytics platform has a Tone Analyzer API, and this is exactly what I used. I also used Python for data extraction, connecting to the API and parsing, and R for the final graphing. Below I discuss the method and results of the analysis.
First, we connect to website with the transcripts of the presidential debate, and using regular expressions, mine for those words that were spoken by each candidate during the debate.
import urllib.request
URL = 'https://www.washingtonpost.com/news/the-fix/wp/2016/10/19/the-final-trump-clinton-debate-transcript-annotated/'
def getWebpage(theURL):
    response = urllib.request.urlopen(theURL)
    html = response.read()
    html = html.decode()
    print("got it!")
    f = open('debatetext.txt', 'w')
    f.write(html)
    f.close()
    print("all done!")

getWebpage(URL)
#use regular expressions to parse out clinton and trump text and join them into one string
import re
data = open(r'debatetext.txt','r').read()
print(len(data))
clinton = re.findall(r'(?<=CLINTON:)(.*)(?=</p>)', data, re.MULTILINE)
trump = re.findall(r'(?<=TRUMP:)(.*)(?=</p>)', data, re.MULTILINE)
clinton = [''.join(clinton[0:len(clinton)])]
trump = [''.join(trump[0:len(trump)])]
print(len(clinton), len(trump))
In order to complete the following step and actually connect to the IBM API, you have to sign up for IBM Bluemix (there is a free tier), and go to the Watson section. Once you've registered, you'll be able to access your credentials and replace the username and password below.
I do not create a function for the json dumping and parsing, but if you were analyzing many speakers, it goes without saying that making a function would be more efficient.
#use the Watson API to analyze tone of both candidates
import json
from watson_developer_cloud import ToneAnalyzerV3
tone_analyzer = ToneAnalyzerV3(
   username='YOUR_USERNAME',
   password='YOUR_PASSWORD',
   version='2016-05-19')
#retrieve, parse clinton data + push to file
clinton = json.dumps(tone_analyzer.tone(text= clinton[0]), indent=2)
clinton_parsed = (json.loads(clinton)['document_tone']) #just keeps document tone, no sentences
for x in clinton_parsed['tone_categories']:
    for y in x['tones']:
        print(y['tone_name'], y['score'])
        tone= ((y['tone_name'],',', str(y['score'])))
        f = open('clintontone.csv','a')
        f.write((''.join(tone))+'\n')
        f.close()
#retrieve, parse trump data + push to file
trump = json.dumps(tone_analyzer.tone(text= trump[0]), indent=2)
trump_parsed = (json.loads(trump)['document_tone']) #just keeps document tone, no sentences
for x in trump_parsed['tone_categories']:
    for y in x['tones']:
        print(y['tone_name'], y['score'])
        tone= ((y['tone_name'],',', str(y['score'])))
        f = open('trumptone.csv','a')
        f.write((''.join(tone))+'\n')
        f.close()
Next is where we open up our data in R and plot it using the plotly package.
#load necessary library
library(plotly)
#create data frames of tone analysis
clinton <- read.csv("clintontone.csv", header=FALSE)
           trump <- read.csv("trumptone.csv", header = FALSE)

#give the data frames headers
colnames(clinton) <- c('tone','clinton' )
colnames(trump) <- c('tone', 'trump')

#merge the data
ctone <- merge(clinton, trump, by='tone')


#plot the data
plot_ly(ctone, x = ~tone, y = ~clinton, type = 'bar', name = 'Clinton', marker=list(color='rbg(0,0,255)')) %>%
    add_trace(y = ~trump, name = 'Trump', marker=list(color='rbg(255,0,0)')) %>%
    layout(title = 'Candidate Tone in Final Debate',
        xaxis = list(title = ''),
        yaxis = list(title = '% in Speech'),
        legend  = list(x = 1, y =1),
        barmode = 'group', bargap = .15)
Voila! Here is my output:
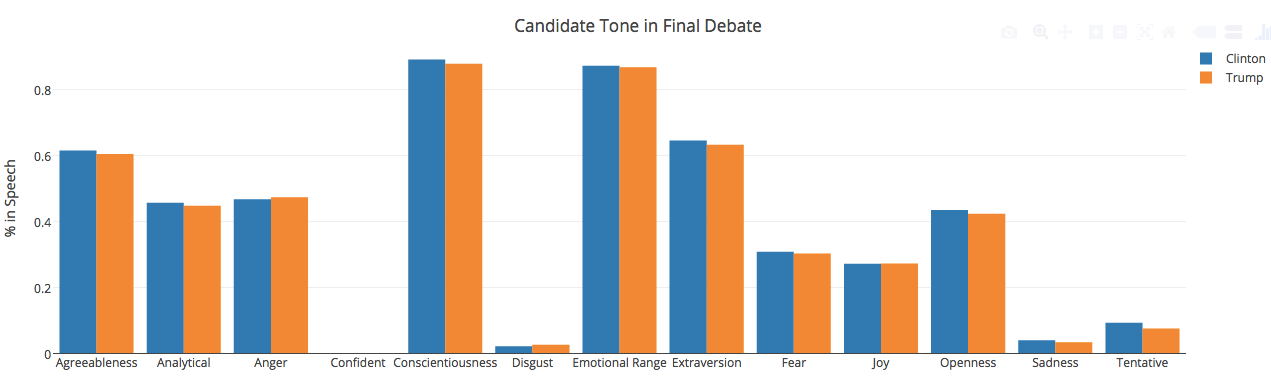
I publish my graphs on RPubs, but you can do whatever you need by just exporting the graph to the appropriate format.
Looking at the above graph, I wonder if IBM's API is working -- both candidates scored almost exactly the same on every tone! 'Confident' could potentially have an issue since both candidates scored 0.0 on this area.
Just to test things out, I go back to the second debate transcripts and run the same code. I use a different website for the transcripts so I have to slightly alter the regular expression to aggregate the text correctly for each candidate. These are the results:
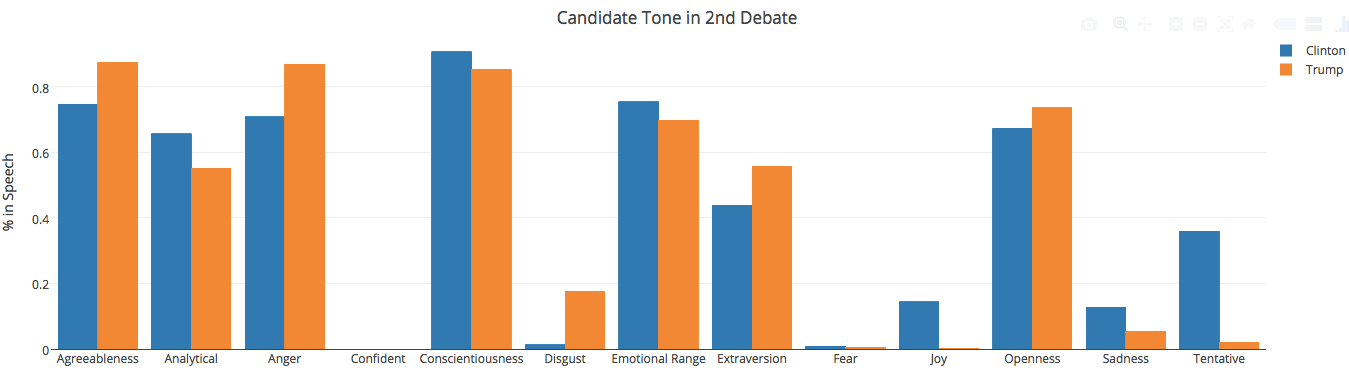
Aha! Taking a quick glance at this graph, we can definitely assume something is wrong with Watson's 'Confident' part of the algorithm. Otherwise, I generally agree more with Watson on this one: Trump expresses more anger in his tone, Hillary expresses more joy and sadness. It makes me wonder if the candidates tried to adjust their tone and rhetoric to what was more appealing to the American people in the final debate, and that's why we ended up with such similar tones then.